常见问题
1、地图无法正常显示?网络问题;
2、地图上用户位置分布不显示?需要等待数据持续加载一段时间,可以正常显示。
3、部分图表不显示数据?修改查询条件query:domain:$domain
概述
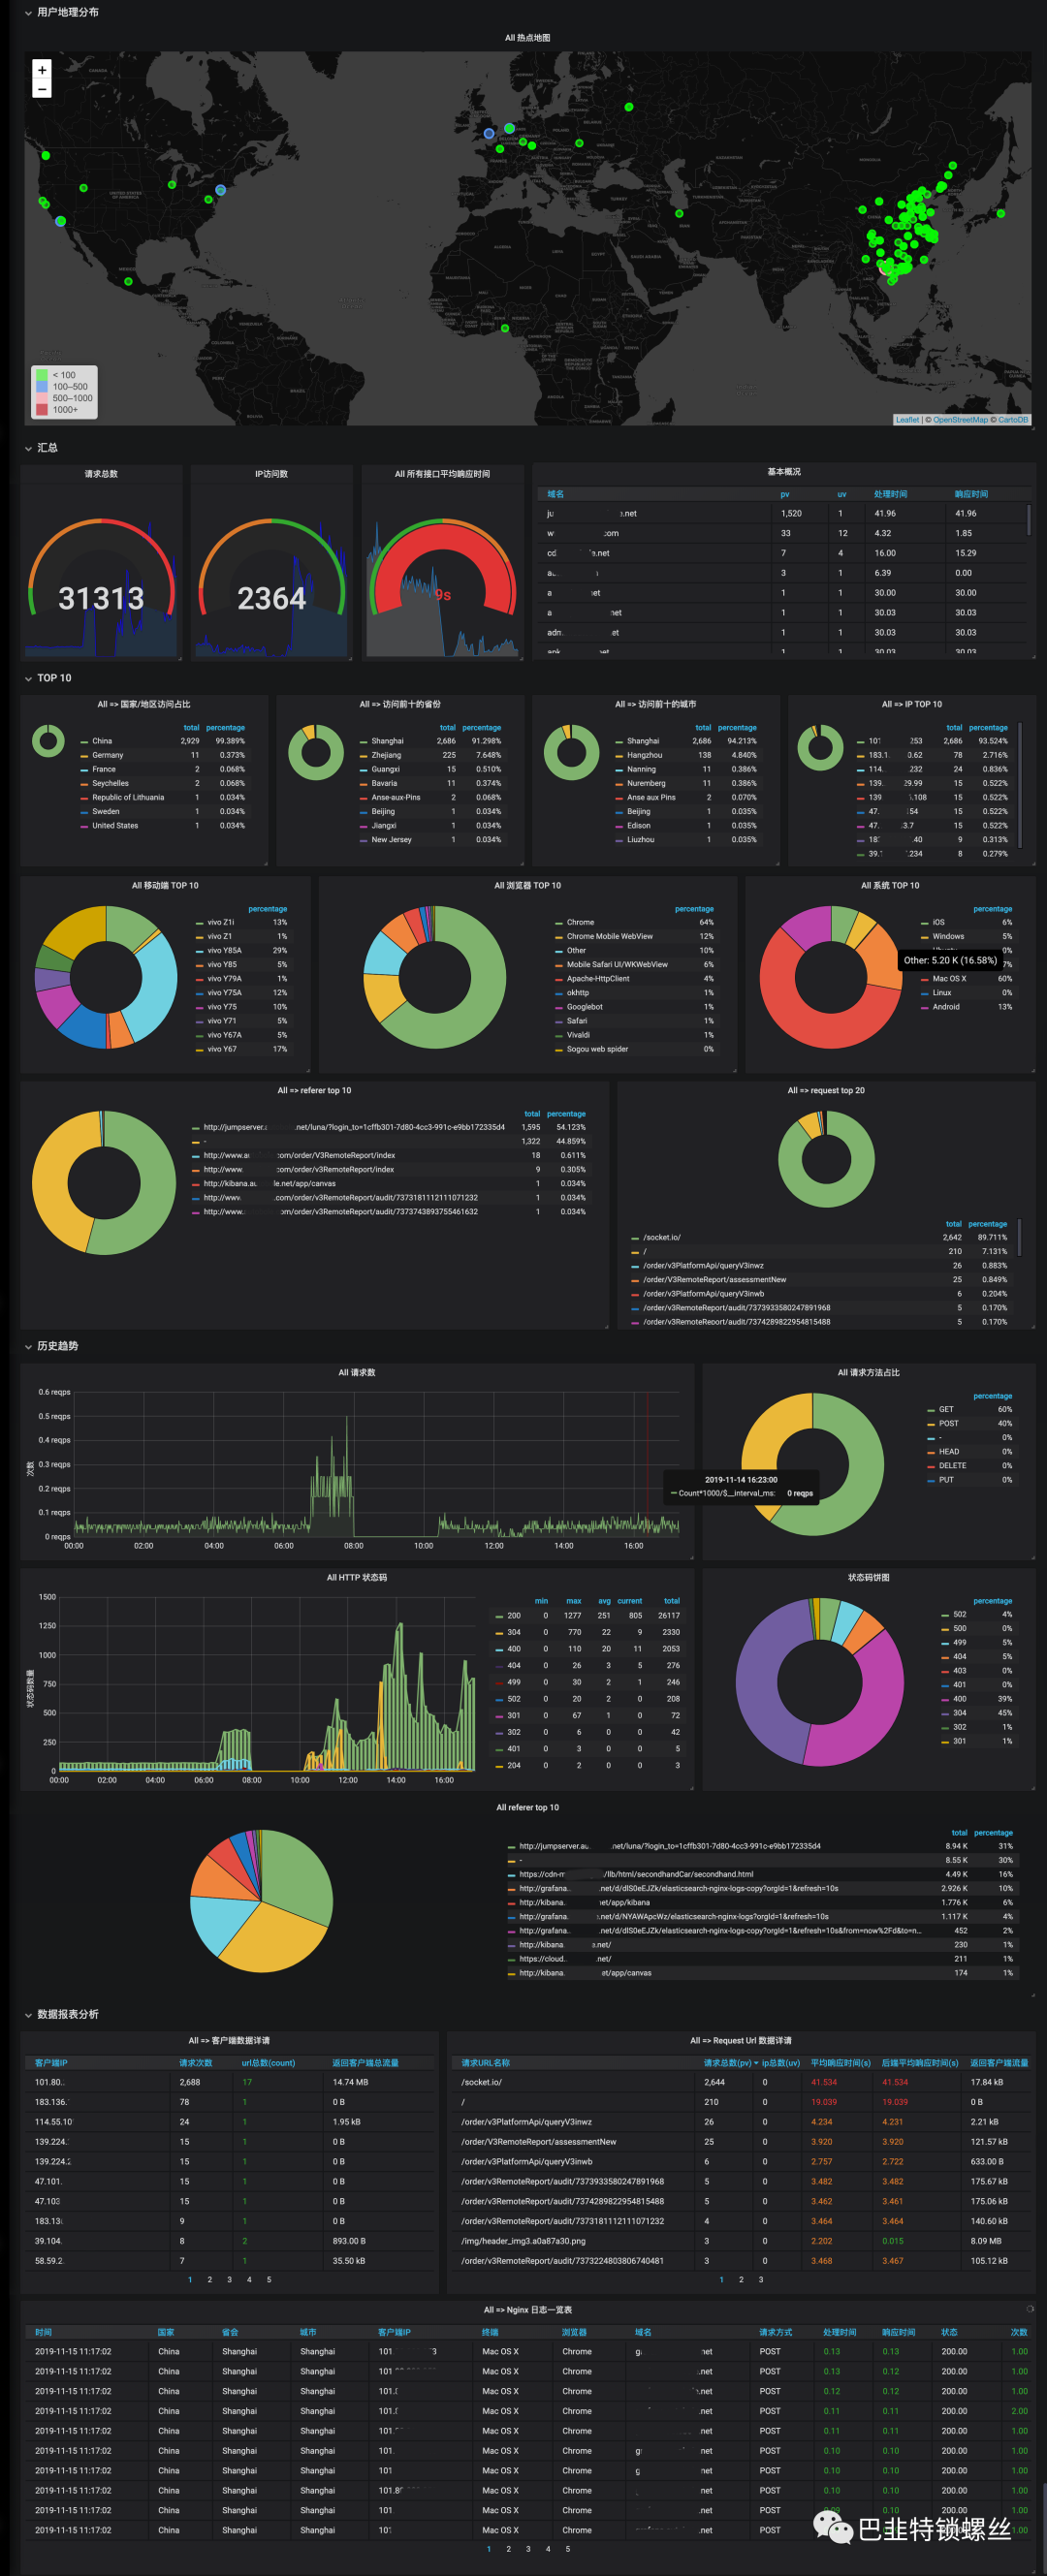
使用ELK收集nginx access日志,利用Grafana做出一套可视化图表,图标效果如下,因生产为内网,因此实际效果会有区别。
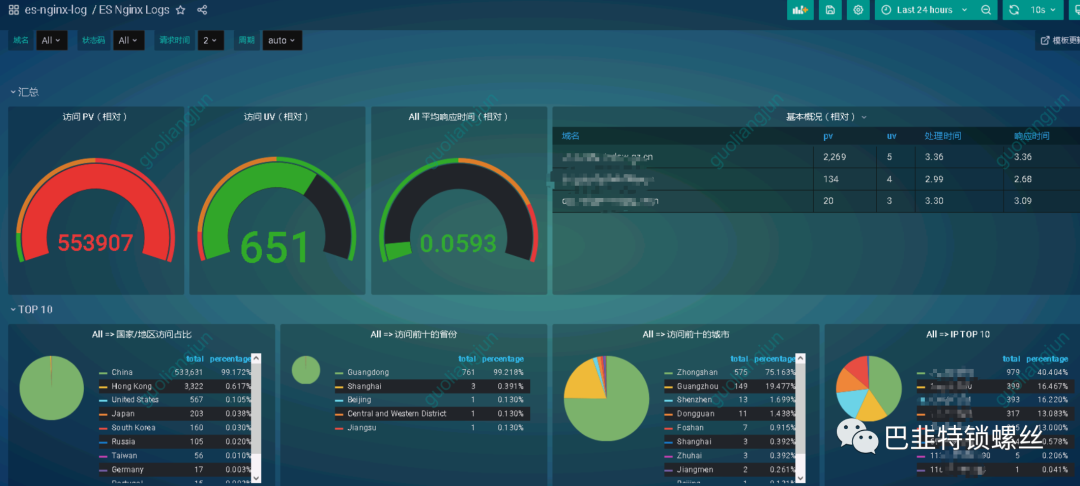
官方效果图:
Nginx 日志字段配置
log_format aka_logs escape=json
  '{"@timestamp":"$time_iso8601",'
  '"host":"$hostname",'
  '"server_ip":"$server_addr",'
  '"client_ip":"$remote_addr",'
  '"xff":"$http_x_forwarded_for",'
  '"domain":"$host",'
  '"url":"$uri",'
  '"referer":"$http_referer",'
  '"args":"$args",'
  '"upstreamtime":"$upstream_response_time",'
  '"responsetime":"$request_time",'
  '"request_method":"$request_method",'
  '"status":"$status",'
  '"size":"$body_bytes_sent",'
  '"request_body":"$request_body",'
  '"request_length":"$request_length",'
  '"protocol":"$server_protocol",'
  '"upstreamhost":"$upstream_addr",'
  '"file_dir":"$request_filename",'
  '"http_user_agent":"$http_user_agent"'
    '}';
Filebeat 配置
name: "ip"

tags: ["ip","nginx"]

filebeat.inputs:
  - type: log
    enabled: true
    paths:
      - "/AppLogs/ngx_acc_logs/xxx.log.json"

    fields:
      filetype: nginx
    fields_under_root: true

    json.keys_under_root: true
    json.overwrite_keys: true
    json.add_error_key: true

output.logstash:
  hosts: ["ip:port"]

# 没有新日志采集后多长时间关闭文件句柄,默认5分钟,设置成1分钟,加快文件句柄关闭
close_inactive: 1m

# 传输了3h后没有传输完成的话就强行关闭文件句柄,这个配置项是解决以上案例问题的key point
close_timeout: 3h

# 这个配置项也应该配置上,默认值是0表示不清理,不清理的意思是采集过的文件描述在registry文件里永不清理,在运行一段时间后,registry会变大,可能会带来问题
clean_inactive: 72h

# 设置了clean_inactive后就需要设置ignore_older,且要保证ignore_older
ignore_older: 70h

# 限制 CPU和内存资源
max_procs: 1 # 限制一个CPU核心,避免过多抢占业务资源
queue.mem.events: 512 # 存储于内存队列的事件数,排队发送 (默认4096)
queue.mem.flush.min_events: 512 # 小于 queue.mem.events ,增加此值可提高吞吐量 (默认值2048)
hosts: ["ip:port"] 请根据实际情况填写。
logstash配置
input {
  beats {
    type => "beat-nginx-logs"
    port => 5044
    codec => json
    client_inactivity_timeout => 3600
  }}

filter {
  if [type] == "beat-nginx-logs" {
    # nginx 日志
    if [xff] != ""{
      geoip {
        target => "geoip"
        source => "xff"
        database => "/usr/share/logstash/GeoLite2-City.mmdb"
        add_field => [ "[geoip][coordinates]", "%{[geoip][longitude]}" ]
        add_field => [ "[geoip][coordinates]", "%{[geoip][latitude]}" ]
        # 去掉显示 geoip 显示的多余信息
        remove_field => ["[geoip][latitude]", "[geoip][longitude]", "[geoip][country_code]", "[geoip][country_code2]", "[geoip][country_code3]", "[geoip][timezone]", "[geoip][continent_code]", "[geoip][region_code]"]
      }
    }else{
      geoip {
        target => "geoip"
        source => "client_ip"
        database => "/usr/share/logstash/GeoLite2-City.mmdb"
        add_field => [ "[geoip][coordinates]", "%{[geoip][longitude]}" ]
        add_field => [ "[geoip][coordinates]", "%{[geoip][latitude]}" ]
        # 去掉显示 geoip 显示的多余信息
        remove_field => ["[geoip][latitude]", "[geoip][longitude]", "[geoip][country_code]", "[geoip][country_code2]", "[geoip][country_code3]", "[geoip][timezone]", "[geoip][continent_code]", "[geoip][region_code]"]
      }
    }

    mutate {
      convert => [ "size", "integer" ]
      convert => [ "status", "integer" ]
      convert => [ "responsetime", "float" ]
      convert => [ "upstreamtime", "float" ]
      convert => [ "[geoip][coordinates]", "float" ]
      # 过滤 filebeat 没用的字段,这里过滤的字段要考虑好输出到es的,否则过滤了就没法做判断
      # remove_field => [ "ecs","agent","host","cloud","@version","input","logs_type" ]
      remove_field => [ "ecs","agent","cloud","@version","input" ]
    }
    # 根据 http_user_agent来自动处理区分用户客户端系统与版本
    useragent {
      source => "http_user_agent"
      target => "ua"
      # 过滤useragent没用的字段
      remove_field => [ "[ua][minor]","[ua][major]","[ua][build]","[ua][patch]","[ua][os_minor]","[ua][os_major]" ]
    }
  }}

output {
  if [type] == "beat-nginx-logs" {
    elasticsearch {
      hosts => "elk-elasticsearch:9200"
      user => "elastic"
      password => "xxx"
      index => "logstash-nginx-log-%{+yyyy.MM.dd}"
    }
  } else {
    stdout { }
  }}
注意2个位置:
/usr/share/logstash/GeoLite2-City.mmdb,这个是地图数据文件elasticsearch {xx} 这里填写elasticsearch信息,由于我的elasticsearch 开启认证,因此需要用户名和密码,请根据实际情况填写。
Grafana配置
前提需要部署grafana
添加数据源
添加elasticsearch数据源
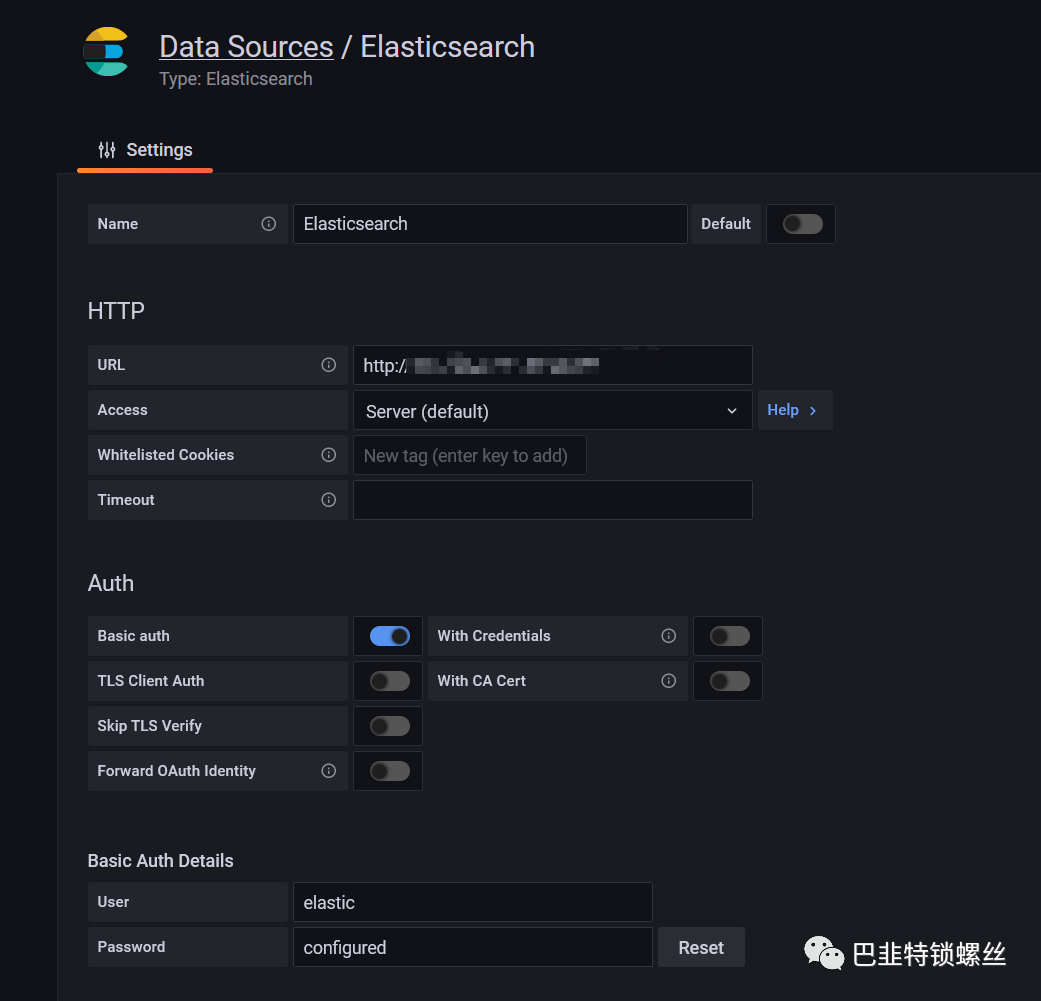
如果elasticsearch需要认证,在下面的Auth设置中,Basic auth开启,输入用户名和密码。
输入索引值,时间戳,选择版本:7.0+
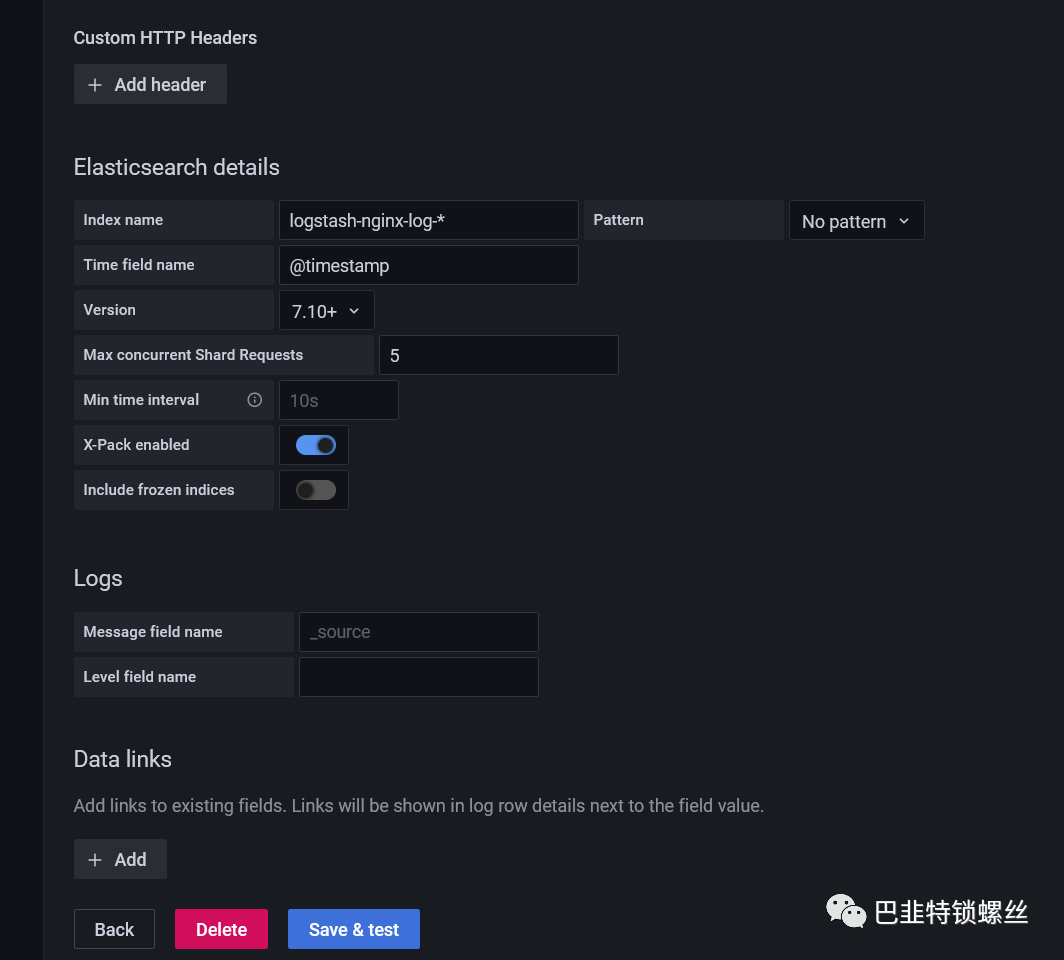
如果测试通过,则会添加成功。
安装插件
有网情况下
进入grafana容器,安装2个插件,用来支持展示图表的。
grafana-cli plugins install grafana-piechart-panel
grafana-cli plugins install grafana-worldmap-panel
内网情况下
访问官网:https://grafana.com/grafana/plugins/离线下载好两个插件,导入到对于路径后重启容器即可。
https://grafana.com/grafana/plugins/grafana-worldmap-panel/
和
https://grafana.com/grafana/plugins/grafana-piechart-panel/
导入模板
模板下载地址为:https://grafana.com/grafana/dashboards/11190
参考:
1.https://blog.csdn.net/qq_24794401/article/details/114275201
2.https://www.cnblogs.com/Lqdream/p/16918607.html

版权声明:本文内容来自个人博客:记忆角落,遵循CC 4.0 BY-SA版权协议上原文接及本声明。本作品采用知识共享署名-非商业性使用-禁止演绎 2.5 中国大陆许可协议进行许可。原文链接:https://199604.com/2751如有涉及到侵权,请联系,将立即予以删除处理。在此特别鸣谢原作者的创作。此篇文章的所有版权归原作者所有,与本公众号无关,商业转载建议请联系原作者,非商业转载请注明出处。