前提需要安装好ELK集群和Grafana。
一、配置Nginx日志输出格式
# 编辑nginx.conf,内容如下
[root@master ~]# vim /usr/local/nginx/conf/nginx.conf
|
log_format json '{"@timestamp":"$time_iso8601",' '"host":"$server_addr",' '"ip":"$remote_addr",' '"clientip":"$remote_addr",' '"remote_user":"$remote_user",' '"request":"$request",' '"http_user_agent":"$http_user_agent",' '"size":$body_bytes_sent,' '"responsetime":$request_time,' '"upstreamtime":"$upstream_response_time",' '"upstreamhost":"$upstream_addr",' '"http_host":"$host",' '"requesturi":"$request_uri",' '"url":"$uri",' '"domain":"$host",' '"xff":"$http_x_forwarded_for",' '"referer":"$http_referer",' '"status":"$status"}'; access_log logs/access.log json; |
注意:这里的Nginx配置所有访问日志,统一在/usr/local/nginx/logs/access.log。
如果你的环境,单独为每一个虚拟主机分配了access日志,那么就需要在对应的虚拟主机配置文件,应用格式json即可。
二、配置Logstash
注意:本文采用Filebeat+Logstash采集nginx日志,并发送给Elasticsearch。
[root@master ~]# cat /etc/logstash/conf.d/nginx.conf
|
input { redis { host => "172.27.5.51" port => "6379" db => "0" password => "Aa123456" data_type => "list" key => "nginx-access-log" codec => "json" } } filter { if [fields][logtype] == "nginx-access-log" { json { source => "message" } mutate { convert => [ "status","integer" ] convert => [ "size","integer" ] convert => [ "upstreamtime","float" ] convert => [ "[geoip][coordinates]","float" ] remove_field => "geoip.continent_code" remove_field => "geoip.country_code2" remove_field => "geoip.country_code3" } date { match => [ "timestamp" ,"dd/MMM/YYYY:HH:mm:ss Z" ] } geoip { source => "ip" target => "geoip" database =>"/usr/share/logstash/GeoLite2-City_20221206/GeoLite2-City.mmdb" add_field => [ "[geoip][coordinates]", "%{[geoip][longitude]}" ] add_field => [ "[geoip][coordinates]", "%{[geoip][latitude]}" ] } mutate { remove_field => "timestamp" } } } output { if [fields][logtype] == "nginx-access-log" { elasticsearch { hosts => ["172.27.5.51:9200"] user => "elastic" password => "www.yangxingzhen.com" action => "index" index => "nginx-access-log-%{+YYYY.MM.dd}" } } } |
注意:/usr/share/logstash/GeoLite2-City_20221206/GeoLite2-City.mmdb,这个是地图数据文件。
GeoLite2-City.mmdb是IP信息解析和地理定位的。官方下载地址: https://www.maxmind.com。
下载文件完成后,将此文件上传到/usr/share/logstash/GeoLite2-City_20221206目录。
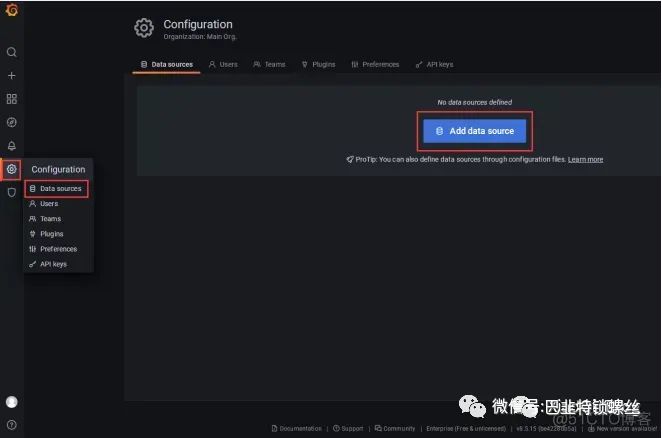
三、配置Grafana
1、访问Grafana,配置Elasticsearch数据源
2、配置ES相关信息
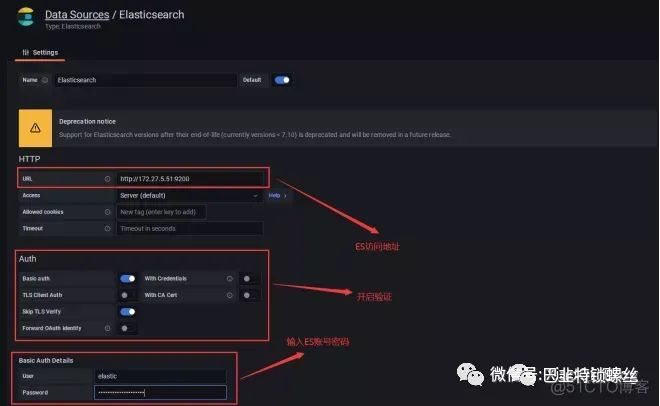
注意:如果elasticsearch需要认证,在下面的Auth设置中,Basic auth开启,输入用户名和密码。
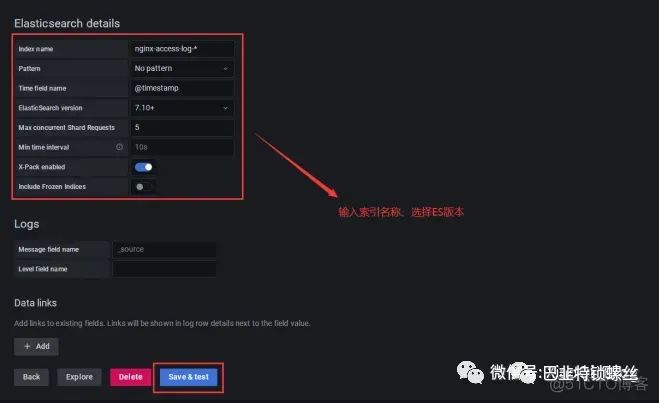
3、配置ES索引信息
4、Grafana安装插件
[root@master ~]# grafana-cli plugins install grafana-piechart-panel
[root@master ~]# grafana-cli plugins install grafana-worldmap-panel
# 安装完成后,重启Grafana生效。
[root@master ~]# systemctl restart grafana-server
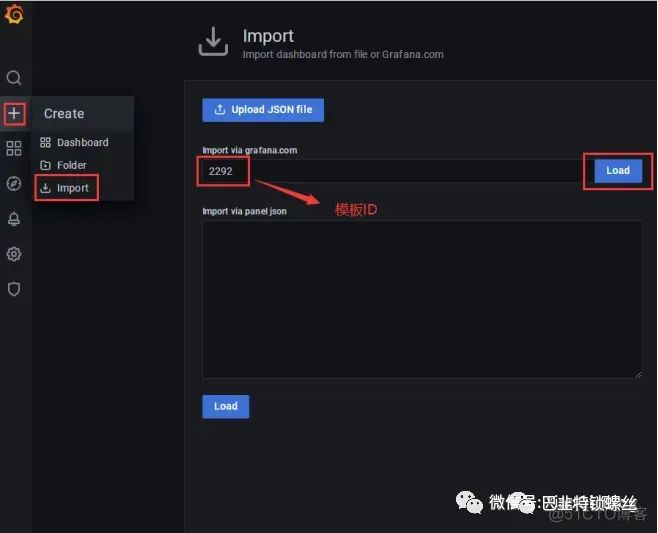
5、配置展示模板
1)输入模板ID,然后点击Load
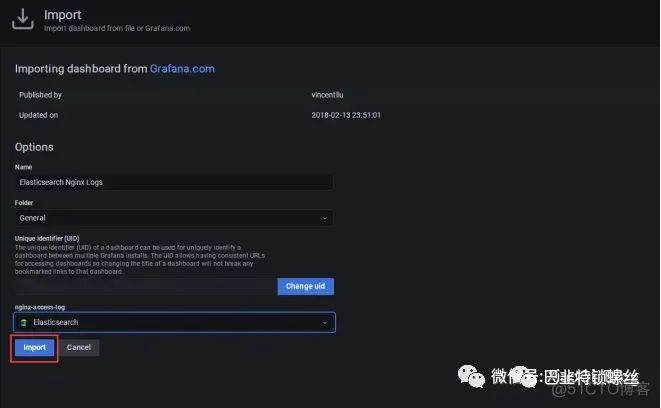
2)模板效果展示
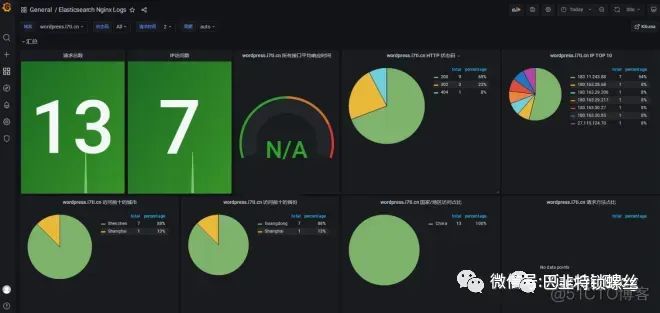
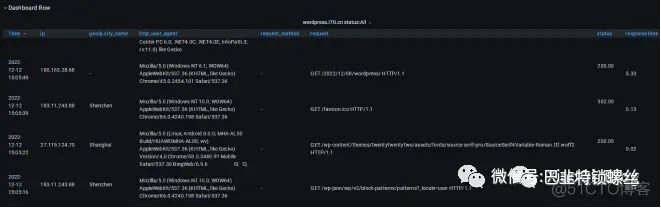
至此,ELK+Grafana分析Nginx日志配置完成。

版权声明:本文内容来自51CTO:小柒博客2023,遵循CC 4.0 BY-SA版权协议上原文接及本声明。本作品采用知识共享署名-非商业性使用-禁止演绎 2.5 中国大陆许可协议进行可。原文链接:https://blog.51cto.com/yangxingzhen/5980523如有涉及到侵权,请联系,将立即予以删除处理。在此特别鸣谢原作者的创作。此篇文章的所有版权归原作者所有,与本公众号无关,商业转载建议请联系原作者,非商业转载请注明出处。