1、环境准备
准备一台虚拟机
2、下载安装包
下载地址:https://prometheus.io/download/
3、安装Prometheus
上传压缩包到服务器
创建安装目录
[]解压安装包
[root@localhost ~]# cd /data[root@localhost data]# tar -xvf prometheus-2.45.1.linux-amd64.tar.gz -C /data/prometheus
更改名字
[][]total 0drwxr-xr-x. 4 1001 127 132 Sep 29 17:46 prometheus-2.45.1.linux-amd64[][]total 0drwxr-xr-x. 4 1001 127 132 Sep 29 17:46 prometheus
创建prometheus用户
useradd -M -s /sbin/nologin prometheus授予prometheus目录权限
chown -R prometheus.prometheus /data/prometheus给prometheus创建systemd服务
cat >> /etc/systemd/system/prometheus.service[Unit]Description=Prometheus ServerDocumentation=https://prometheus.io/docs/introduction/overviewAfter=network-online.target[Service]Type=simpleUser=prometheusGroup=prometheusRestart=on-failureExecStart=/data/prometheus/prometheus/prometheus--config.file=/data/prometheus/prometheus/prometheus.yml--storage.tsdb.path=/data/prometheus/prometheus/data--storage.tsdb.retention.time=60d--web.enable-lifecycle[Install]WantedBy=multi-user.targetEOF
重载服务
systemctl daemon-reload启动prometheus并设置开机自启动
systemctl enable --now prometheus.service检查状态
systemctl status prometheus.service访问prometheus
4、安装alertmanager
下载地址:https://prometheus.io/download/
解压安装包
tar -xf alertmanager-0.26.0.linux-amd64.tar.gz -C /data/prometheus更名为alertmanager
mv /data/prometheus/alertmanager-0.26.0.linux-amd64/ /data/prometheus/alertmanager更改alertmanager权限
chown -R prometheus.prometheus /data/prometheus/alertmanager给alertmanager创建systemd服务
cat >> /etc/systemd/system/alertmanager.service[Unit]Desciption=Alert Managerwants=network-online.targetAfter=network-online.target[Service]Type=simpleUser=prometheusGroup=prometheusExecStart=/data/prometheus/alertmanager/alertmanager--config.file=/data/prometheus/alertmanager/alertmanager.yml--storage.path=/data/prometheus/alertmanager/dataRestart=always[Install]WantedBy=multi-user.targetEOF
启动alertmanager
systemctl daemon-reloadsystemctl enable --now alertmanager.service
将alertmanager加入prometheus。
vi /data/prometheus/prometheus.ymlalerting:alertmanagers:- static_configs:- targets:# 根据实际填写alertmanager的IP地址- localhost:9093rule_files:# 根据实际名修改文件名- "alert.yml"
增加触发器配置文件
cat >> /data/prometheus/prometheus/alert.ymlgroups:name: Prometheus alertrules:# 对任何实例超过30s无法联系的清空发出警报alert: 服务告警expr: up == 0for: 30slabels:severity: criticalannotations:instance: "{{ $labels.instance }}"description: "{{ $labels.job }} 服务已关闭"EOF
检查配置
cd /data/prometheus/prometheusprometheus]# ./promtool check config prometheus.ymlChecking prometheus.ymlSUCCESS: 1 rule files foundSUCCESS: prometheus.yml is valid prometheus config file syntaxChecking alert.ymlSUCCESS: 1 rules found
重启prometheus
systemctl restart prometheus访问alertmanager:http://10.13.2.13:9093
5、安装Grafana
下载地址:https://grafana.com/grafana/download
直接获取
wget https://dl.grafana.com/enterprise/release/grafana-enterprise-10.1.4.linux-amd64.tar.gz解压安装包
tar -xvf grafana-enterprise-10.1.4.linux-amd64.tar.gz -C /data/prometheusmv grafana-10.1.4/ grafana
更改grafana目录权限
chown -R prometheus.prometheus /data/prometheus给grafana创建systemd服务
cat >> /etc/systemd/system/grafana-server.service[Unit]Description=Grafana serverDocumetation=http://dosc.grafana.org[Service]Type=simpleUser=prometheusGroup=prometheusRestart=on-failureExecStart=/data/prometheus/grafana/bin/grafana-server --config=/data/prometheus/grafana/conf/defaults.ini --homepath=/data/prometheus/grafana[Install]WantedBy=multi-user.targetEOF
启动grafana
systemctl daemon-reloadsystemctl start grafana-server.service
加入开机自启动
systemctl enable grafana-server.service查看状态
systemctl status grafana-server.service访问:
http://10.13.2.13:3000
默认用户名/密码:admin/admin
6、安装node_exporter
解压
tar -xf node_exporter-1.6.1.linux-amd64.tar.gz -C /data/prometheus/cd /data/prometheus/mv node_exporter-1.6.1.linux-amd64/ node_exporter
修改权限
chown prometheus.prometheus -R /data/prometheus/node_exporter给node_exporter创建systemd服务
cat >> /etc/systemd/system/node_exporter.service[Unit]Description=node_exporterDocumentation=https://prometheus.io/After=network.target[Service]User=prometheusGroup=prometheusExecStart=/data/prometheus/node_exporter/node_exporterRestart=on-failureEOF
启动node_exporter
systemctl daemon-reloadsystemctl enable --now node_exporter.service
访问地址:http://10.13.2.13:9100/metrics
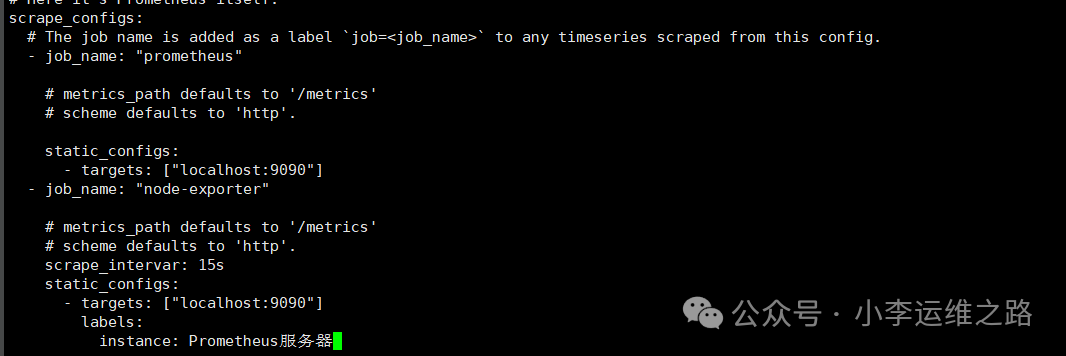
添加exporter到prometheus
cat /data/prometheus/prometheus/prometheus.yml-job_name: "node-exporter"scrape_intervar: 15sstatic_configs:- targets: ["10.13.2.13:9100"]
重载prometheus
curl -X POST http://localhost:9090/-/reload7、登录grafana添加prometheus
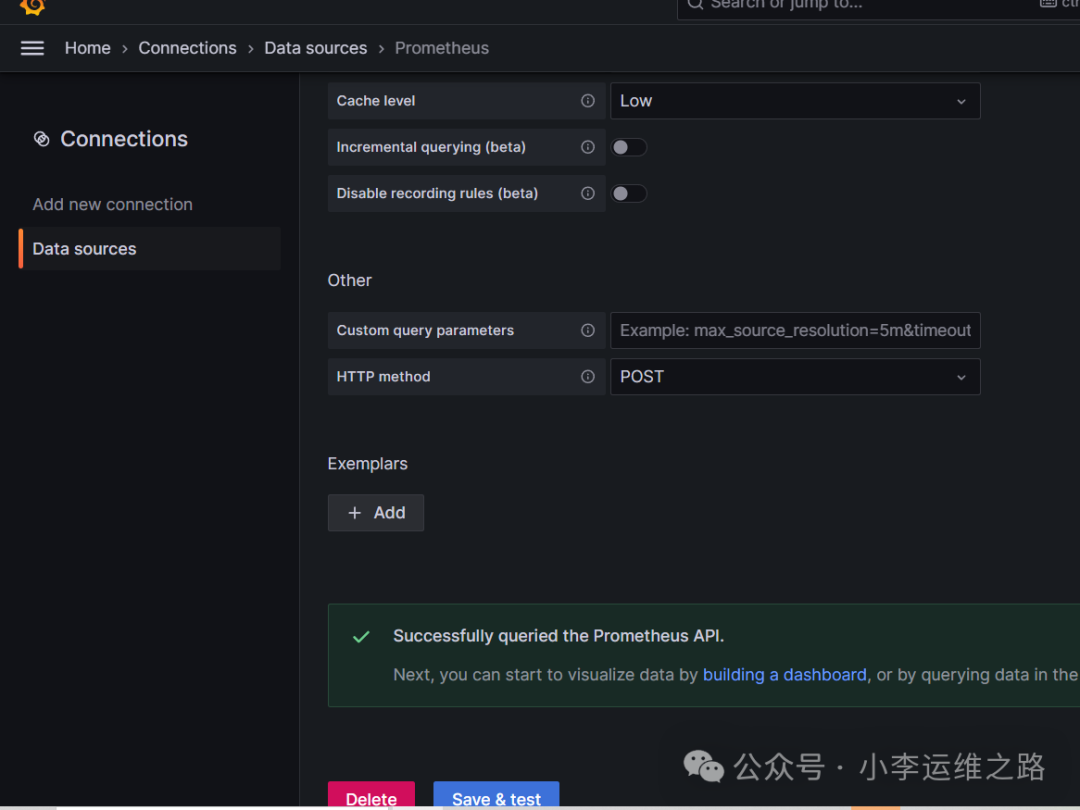
从Grafana.com导入仪表盘
https://grafana.com/grafana/dashboards
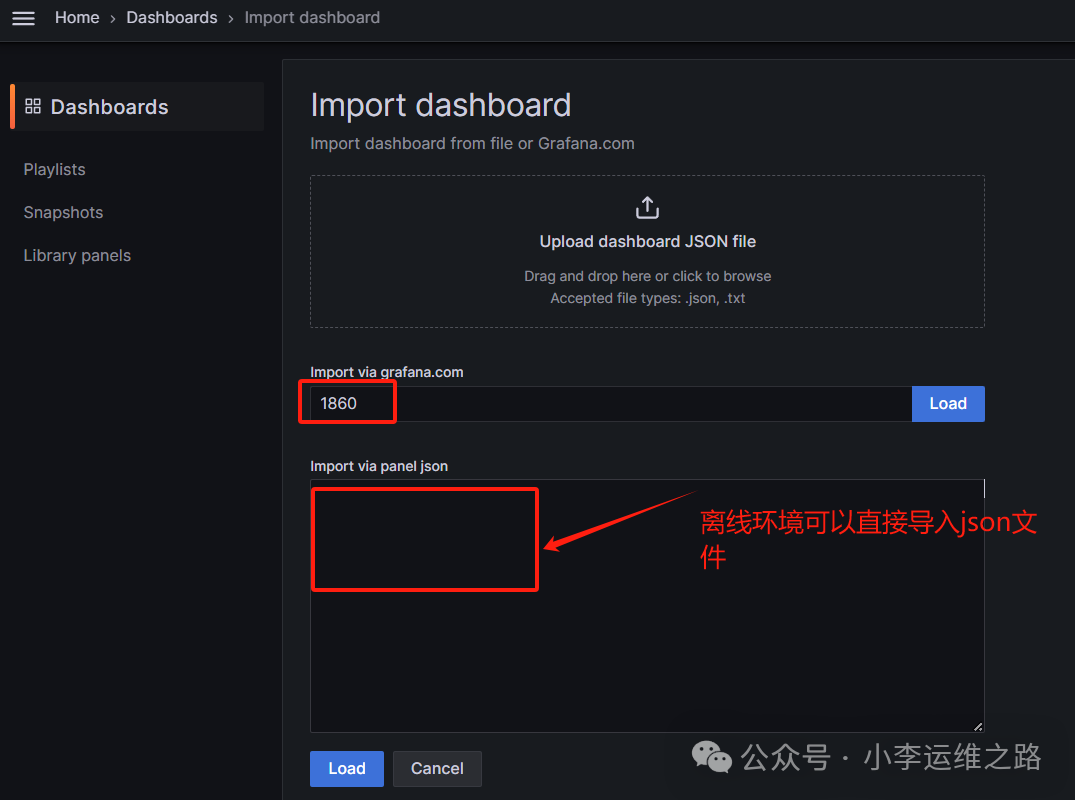
在grafana右上角处点击Import dashboard,
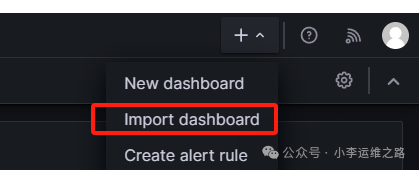
导入id号或json文件,在grafana官网可以直接获取。
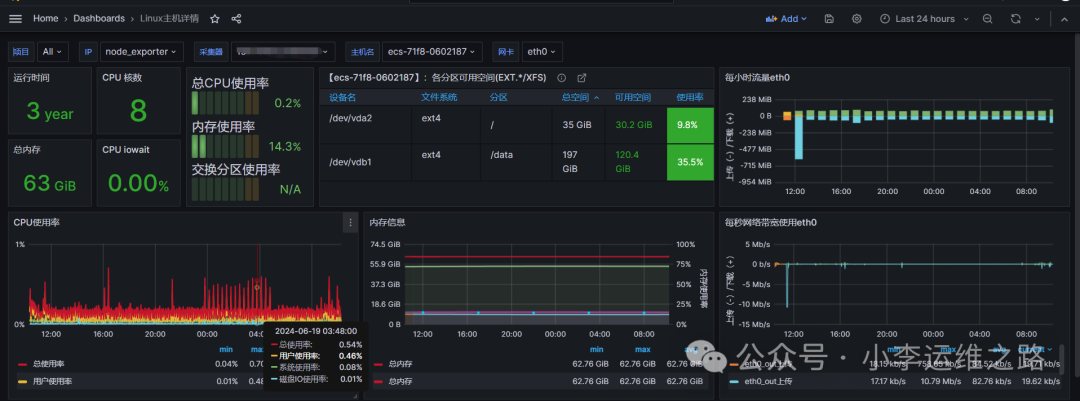
生产环境示例:Linux主机详情和Linux主机列表”
Linux主机详情的dashboard ID:12633
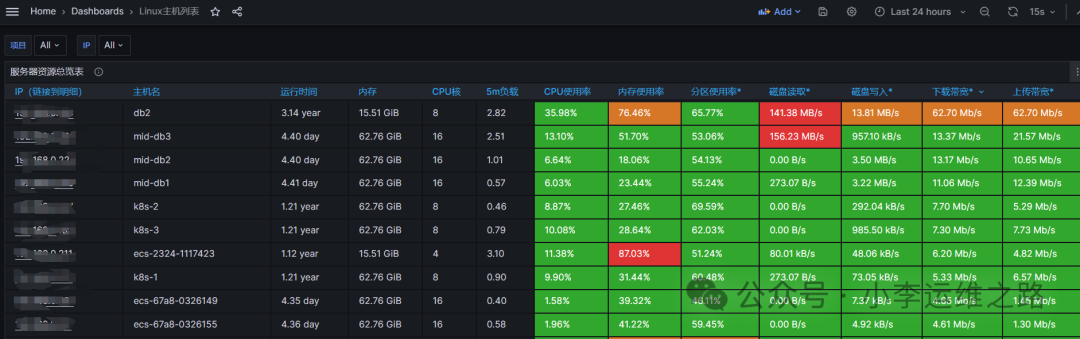
Linux主机列表的dashboard ID:12632
本篇关于prometheus部署的学习分享完结!感谢你的阅读,如果觉得还OK,欢迎点赞 ;关注 ; 收藏 ; 私信!!!