安装grafana套件
直接使用docker安装,官网有详细教程。
安装grafana
安装loki+promtail
按官方的教程,再结合实际情况安装的loki+promtail
loki
# 拉取lokidocker pull grafana/loki:2.8.0# 下载loki配置文件curl -o loki.yaml https://raw.githubusercontent.com/grafana/loki/v2.8.0/cmd/loki/loki-local-config.yaml# 移动到/var/docker/grafana目录下mv loki.yaml /var/docker/grafana/# 启动docker run --name loki -d -v /var/docker/grafana:/mnt/config -p 3100:3100 --network grafana grafana/loki:2.8.0 -config.file=/mnt/config/loki.yaml
promtail
# 拉取promtaildocker pull grafana/promtail:2.8.0# 下载promtail配置文件curl -o promtail.yaml# 移动到/var/docker/grafana目录下mv promtail.yaml /var/docker/grafana/
配置需要稍微修改下
server:http_listen_port: 0 # 使用本地日志,不需要监听端口grpc_listen_port: 0positions:filename: /tmp/positions.yamlclients:# 172.18.0.2是docker network给loki分配的的ip地址scrape_configs:pipeline_stages:expression: '(?:[0-9]{1,3}.){3}([0-9]{1,3})'replace: '***'static_configs:labels:job: varlogs__path__: /var/log/fhsk.log # 使用指定的log文件
运行promtail
docker run --name promtail -d -v /var/docker/grafana:/mnt/config -v /usr/local/nginx-1.22.1/logs/fhsk.access.log:/var/log/fhsk.log --network grafana --link loki grafana/promtail:2.8.0 -config.file=/mnt/config/promtail.yaml
修改Nginx日志格式
因为我使用的是grafana的Grafana Loki Dashboard for NGINX Service Mesh面板,所以需要按照他的要求,调整Nginx格式。
说明:我这里没有使用geoip模块,因为难得搞。
log_format json_analytics escape=json '{''"msec": "$msec", ' # request unixtime in seconds with a milliseconds resolution'"connection": "$connection", ' # connection serial number'"connection_requests": "$connection_requests", ' # number of requests made in connection'"pid": "$pid", ' # process pid'"request_id": "$request_id", ' # the unique request id'"request_length": "$request_length", ' # request length (including headers and body)'"remote_addr": "$remote_addr", ' # client IP'"remote_user": "$remote_user", ' # client HTTP username'"remote_port": "$remote_port", ' # client port'"time_local": "$time_local", ''"time_iso8601": "$time_iso8601", ' # local time in the ISO 8601 standard format'"request": "$request", ' # full path no arguments if the request'"request_uri": "$request_uri", ' # full path and arguments if the request'"args": "$args", ' # args'"status": "$status", ' # response status code'"body_bytes_sent": "$body_bytes_sent", ' # the number of body bytes exclude headers sent to a client'"bytes_sent": "$bytes_sent", ' # the number of bytes sent to a client'"http_referer": "$http_referer", ' # HTTP referer'"http_user_agent": "$http_user_agent", ' # user agent'"http_x_forwarded_for": "$http_x_forwarded_for", ' # http_x_forwarded_for'"http_host": "$http_host", ' # the request Host: header'"server_name": "$server_name", ' # the name of the vhost serving the request'"request_time": "$request_time", ' # request processing time in seconds with msec resolution'"upstream": "$upstream_addr", ' # upstream backend server for proxied requests'"upstream_connect_time": "$upstream_connect_time", ' # upstream handshake time incl. TLS'"upstream_header_time": "$upstream_header_time", ' # time spent receiving upstream headers'"upstream_response_time": "$upstream_response_time", ' # time spend receiving upstream body'"upstream_response_length": "$upstream_response_length", ' # upstream response length'"upstream_cache_status": "$upstream_cache_status", ' # cache HIT/MISS where applicable'"ssl_protocol": "$ssl_protocol", ' # TLS protocol'"ssl_cipher": "$ssl_cipher", ' # TLS cipher'"scheme": "$scheme", ' # http or https'"request_method": "$request_method", ' # request method'"server_protocol": "$server_protocol", ' # request protocol, like HTTP/1.1 or HTTP/2.0'"pipe": "$pipe", ' # "p" if request was pipelined, "." otherwise'"gzip_ratio": "$gzip_ratio", ''"http_cf_ray": "$http_cf_ray",''}';access_log /usr/local/nginx-1.22.1/logs/fhsk.access.log json_analytics;
重启后生效。
进入grafana网站监控
grafana的默认账号密码为admin/admin,登录后会要求修改密码。
添加数据源
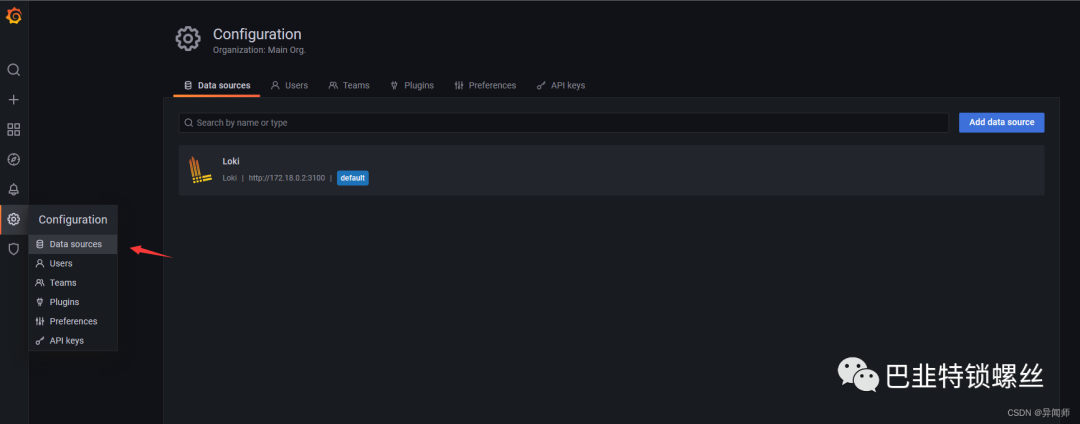
配置loki的地址+端口,可以使用docker network inspect grafana查看给loki分配的地址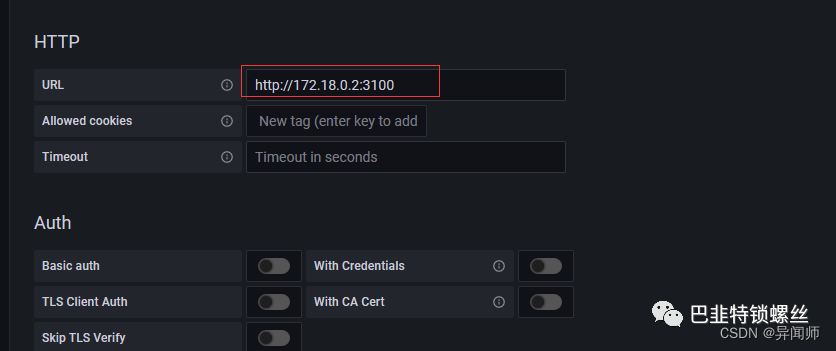
然后点击保存即可。
导入可视化面板
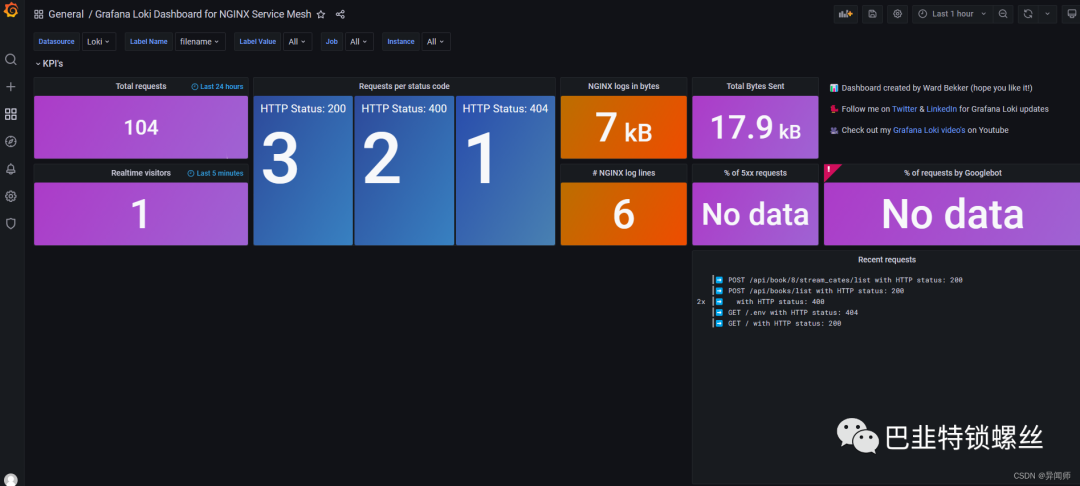
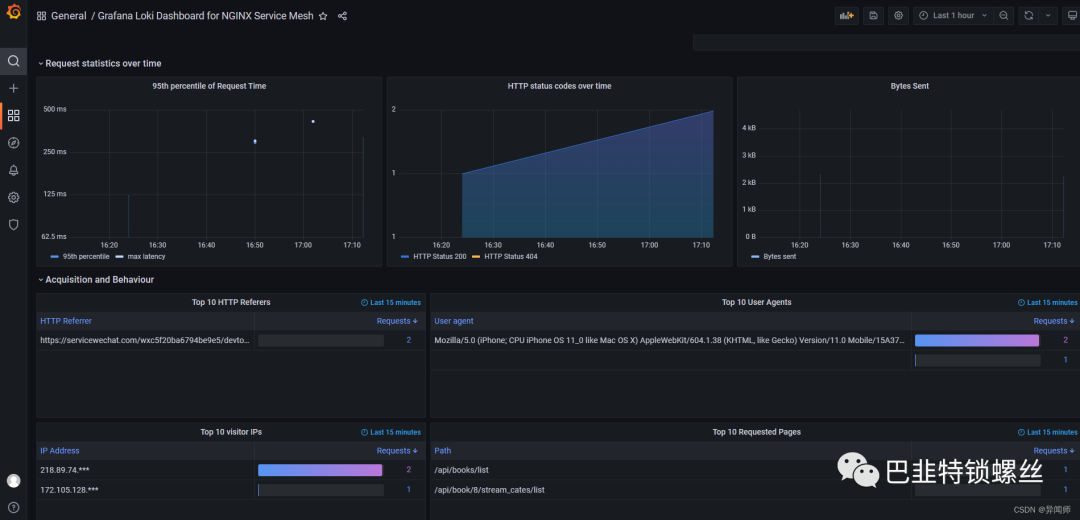
grafana有很多现成的面板,我使用的是grafana+loki来分析Nginx,所以选择了Grafana Loki Dashboard for NGINX Service Mesh面板。
加载方式也有两种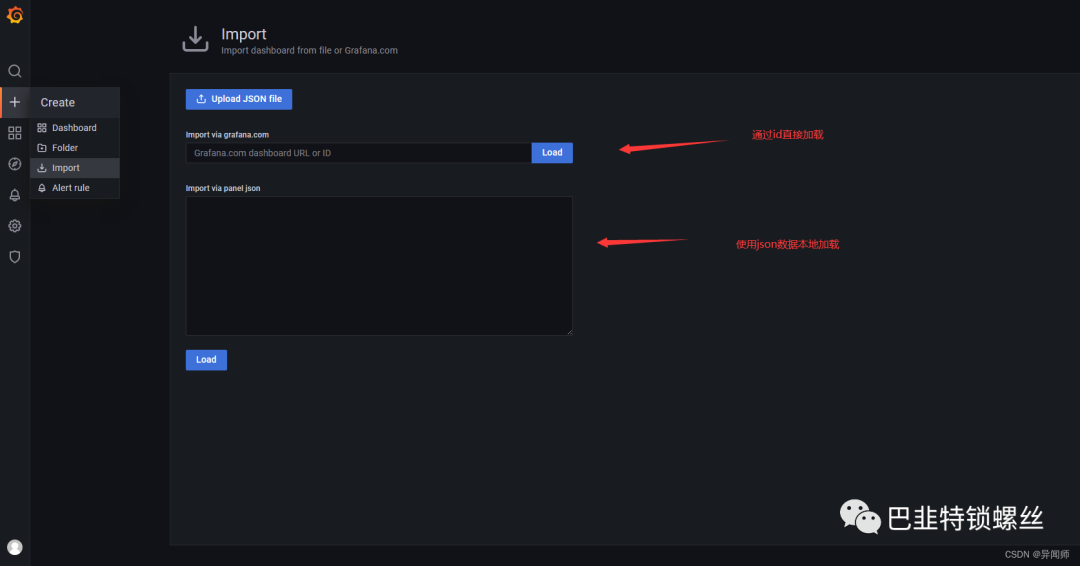
对应到面板网站的这里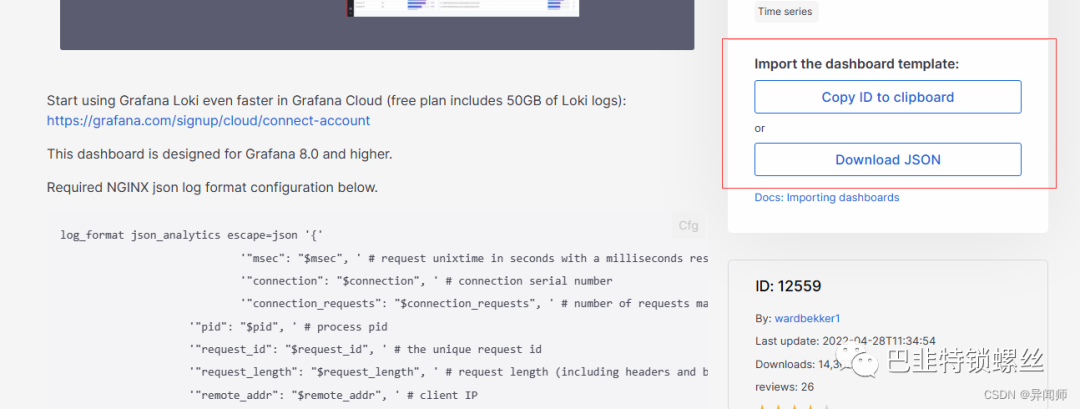
效果展示

版权声明:本文内容来自知乎:异闻师,遵循CC 4.0 BY-SA版权协议上原文接及本声明。本作品采用知识共享署名-非商业性使用-禁止演绎 2.5 中国大陆许可协议进行可。原文链接:https://blog.csdn.net/qq_39810587/article/details/130289125如有涉及到侵权,请联系,将立即予以删除处理。在此特别鸣谢原作者的创作。此篇文章的所有版权归原作者所有,与本公众号无关,商业转载建议请联系原作者,非商业转载请注明出处。