一、采集nginx json格式日志
1、配置nginx日志输出格式
log_format json '{"@timestamp":"$time_iso8601",''"@source":"$server_addr",''"clientip":"$remote_addr",''"request_method":"$request_method",''"scheme":"$scheme",''"domain":"$host",''"referer":"$http_referer",''"request":"$request_uri",''"args":"$args",''"size":$body_bytes_sent,''"status": $status,''"responsetime":$request_time,''"upstreamtime":"$upstream_response_time",''"upstreamaddr":"$upstream_addr",''"http_user_agent":"$http_user_agent",''"https":"$https"''}';access_log /data/logs_nginx/access.json.log json;
2、在nginx服务器上安装filebeat
wget https://artifacts.elastic.co/downloads/beats/filebeat/filebeat-6.3.1-x86_64.rpmyum localinstall filebeat-6.3.1-x86_64.rpm
3、配置filebeat采集文件
path: /data/logs/filebeatname: filebeat.logkeepfiles: 7permissions: 0644enabled: trueexclude_lines: ['\x']fields:paths:# initial brokers for reading cluster metadatahosts: ["kafka1:9092", "kafka2:9092", "kafka3:9092"]# message topic selection + partitioningtopic: '%{[fields][log-type]}'reachable_only: falserequired_acks: 1compression: snappymax_message_bytes: 1000000
4、启动filebeat
systemctl start filebeat二、配置logstash过滤规则并存储到elasticsearch
1、下载geoip库
cd /opt/server/logstashmkdir GeoLite2-City
将下载好的GeoLite2-City.mmdb文件放入GeoLite2-City目录
下载链接:https://dev.maxmind.com/geoip/geoip2/geolite2/
2、配置logstash过滤nginx日志规则
cd conf.dvim nginx-access.conf
input{kafka{bootstrap_servers => ["kafka1:9092,kafka2:9092,kafka3:9092"]client_id => "nginx-access-logs"group_id => "logstash"auto_offset_reset => "latest"consumer_threads => 10decorate_events => truetopics => ["nginx-access-logs"]type => "nginx-access-logs"codec => json {charset => "UTF-8"}}}filter {if [fields][log-type] == "nginx-access-logs" {json {source => "message"}mutate {convert => [ "status","integer" ]convert => [ "size","integer" ]convert => [ "upstreamtime","float" ]convert => ["[geoip][coordinates]", "float"]remove_field => "message"}date {match => [ "timestamp" ,"dd/MMM/YYYY:HH:mm:ss Z" ]}geoip {source => "clientip"target => "geoip"database =>"/usr/share/logstash/GeoLite2-City/GeoLite2-City.mmdb"add_field => [ "[geoip][coordinates]", "%{[geoip][longitude]}" ]add_field => [ "[geoip][coordinates]", "%{[geoip][latitude]}" ]}mutate {remove_field => "timestamp"}if "_geoip_lookup_failure" in [tags] { drop { } } ### 如果解析的地址是内网IP geoip解析将会失败,会生成_geoip_lookup_failure字段,这段话的意思是如果内网地址 drop掉这个字段。}}output {if [fields][log-type] == "nginx-access-logs" {elasticsearch {hosts => ["http://es1:9200","http://es2:9200","http://es3:9200"]index => "nginx-access-%{+YYYY.MM.dd}"}}}
3、重启logstash
三、安装grafana
1、下载安装
wget https://dl.grafana.com/oss/release/grafana-6.3.1-1.x86_64.rpmyum localinstall grafana-6.3.1-1.x86_64.rpm
2、启动服务
3、安装piechart、worldmap插件
4、重启服务
四、配置Grafana
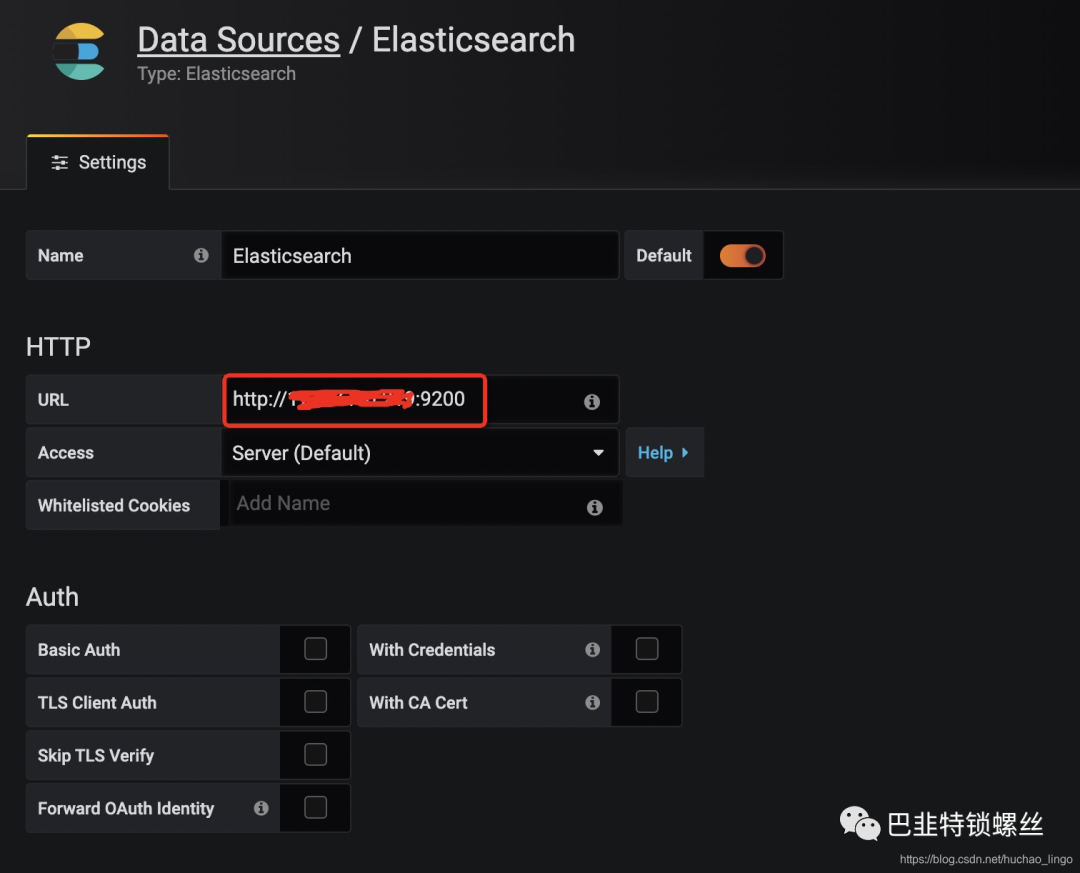
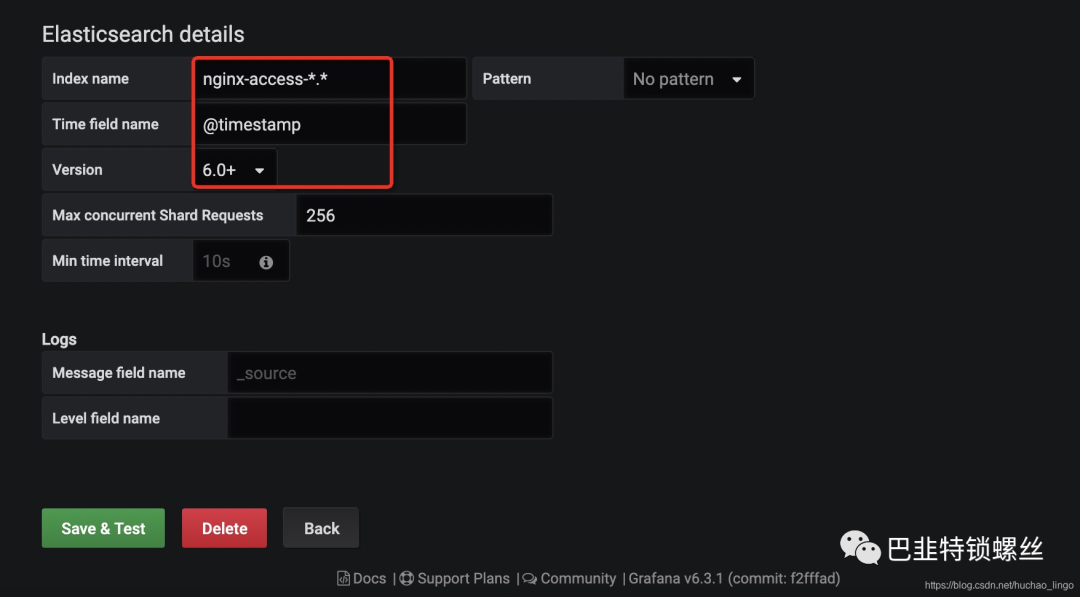
1、配置Grafana数据源

2、配置Grafana 画图模版
[外链图片转存失败,源站可能有防盗链机制,建议将图片保存下来直接上传(img-vs6ltSmC-1578299891778)(images/image-20200106135016104.png)]
JSON内容如下
{"annotations": {"list": [{"builtIn": 1,"datasource": "-- Grafana --","enable": true,"hide": true,"iconColor": "rgba(0, 211, 255, 1)","name": "Annotations & Alerts","type": "dashboard"}]},"description": "Browse, analyze logs in Elasticsearchstatus_codes, pie-chart, top 10 clientip, line-chart,word-map and etc...","editable": true,"gnetId": 2292,"graphTooltip": 0,"id": 1,"iteration": 1578297076611,"links": [{"icon": "external link","tags": [],"targetBlank": true,"title": "Kibana","type": "link","url": "http://172.16.10.223:5601"}],"panels": [{"collapsed": false,"gridPos": {"h": 1,"w": 24,"x": 0,"y": 0},"id": 36,"panels": [],"repeat": null,"title": "汇总","type": "row"},{"cacheTimeout": null,"colorBackground": true,"colorValue": false,"colors": ["rgba(50, 172, 45, 0.97)","rgba(237, 129, 40, 0.89)","rgba(245, 54, 54, 0.9)"],"datasource": "Elasticsearch","editable": true,"error": false,"format": "none","gauge": {"maxValue": 100,"minValue": 0,"show": false,"thresholdLabels": false,"thresholdMarkers": true},"gridPos": {"h": 11,"w": 4,"x": 0,"y": 1},"id": 17,"interval": null,"links": [],"mappingType": 1,"mappingTypes": [{"name": "value to text","value": 1},{"name": "range to text","value": 2}],"maxDataPoints": 100,"nullPointMode": "connected","nullText": null,"options": {},"postfix": "","postfixFontSize": "80%","prefix": "","prefixFontSize": "200%","rangeMaps": [{"from": "null","text": "N/A","to": "null"}],"sparkline": {"fillColor": "rgba(31, 118, 189, 0.18)","full": true,"lineColor": "rgb(0, 4, 244)","show": true},"tableColumn": "","targets": [{"bucketAggs": [{"field": "@timestamp","id": "2","settings": {"interval": "$inter","min_doc_count": 0,"trimEdges": 0},"type": "date_histogram"}],"dsType": "elasticsearch","metrics": [{"field": "clientip.keyword","id": "1","meta": {},"settings": {},"type": "count"}],"query": "domain:"$domain" and user_agent!='MSIE' and user_agent!='Zabbix'","refId": "A","timeField": "@timestamp"}],"thresholds": "300000,500000","title": "请求总数","type": "singlestat","valueFontSize": "100%","valueMaps": [{"op": "=","text": "N/A","value": "null"}],"valueName": "total"},{"cacheTimeout": null,"colorBackground": true,"colorValue": false,"colors": ["rgba(50, 172, 45, 0.97)","rgba(237, 129, 40, 0.89)","rgba(245, 54, 54, 0.9)"],"datasource": "Elasticsearch","editable": true,"error": false,"format": "none","gauge": {"maxValue": 100,"minValue": 0,"show": false,"thresholdLabels": false,"thresholdMarkers": true},"gridPos": {"h": 11,"w": 4,"x": 4,"y": 1},"id": 1,"interval": null,"links": [],"mappingType": 1,"mappingTypes": [{"name": "value to text","value": 1},{"name": "range to text","value": 2}],"maxDataPoints": 100,"nullPointMode": "connected","nullText": null,"options": {},"postfix": "","postfixFontSize": "80%","prefix": "","prefixFontSize": "200%","rangeMaps": [{"from": "null","text": "N/A","to": "null"}],"sparkline": {"fillColor": "rgba(31, 118, 189, 0.18)","full": true,"lineColor": "rgb(0, 14, 245)","show": true},"tableColumn": "","targets": [{"alias": "","bucketAggs": [{"field": "@timestamp","id": "2","settings": {"interval": "$inter","min_doc_count": 0,"trimEdges": 0},"type": "date_histogram"}],"dsType": "elasticsearch","metrics": [{"field": "clientip.keyword","id": "1","meta": {},"settings": {},"type": "cardinality"}],"query": "domain:"$domain" and user_agent!='MSIE' and user_agent!='Zabbix'","refId": "A","timeField": "@timestamp"}],"thresholds": "10000,100000","title": "IP访问数","type": "singlestat","valueFontSize": "100%","valueMaps": [{"op": "=","text": "N/A","value": "null"}],"valueName": "total"},{"cacheTimeout": null,"colorBackground": true,"colorValue": false,"colors": ["rgba(50, 172, 45, 0.97)","rgba(237, 129, 40, 0.89)","rgba(245, 54, 54, 0.9)"],"datasource": "Elasticsearch","format": "none","gauge": {"maxValue": 1,"minValue": 0,"show": true,"thresholdLabels": false,"thresholdMarkers": true},"gridPos": {"h": 11,"w": 4,"x": 8,"y": 1},"id": 24,"interval": null,"links": [],"mappingType": 1,"mappingTypes": [{"name": "value to text","value": 1},{"name": "range to text","value": 2}],"maxDataPoints": 100,"maxPerRow": 4,"nullPointMode": "connected","nullText": null,"options": {},"postfix": "s","postfixFontSize": "50%","prefix": "","prefixFontSize": "50%","rangeMaps": [{"from": "null","text": "N/A","to": "null"}],"sparkline": {"fillColor": "rgba(240, 246, 239, 0.18)","full": true,"lineColor": "rgb(31, 120, 193)","show": true},"tableColumn": "","targets": [{"bucketAggs": [{"field": "@timestamp","id": "2","settings": {"interval": "auto","min_doc_count": 0,"trimEdges": 0},"type": "date_histogram"}],"dsType": "elasticsearch","groupBy": [{"params": ["$__interval"],"type": "time"},{"params": ["null"],"type": "fill"}],"metrics": [{"field": "responsetime","id": "1","meta": {},"settings": {},"type": "avg"}],"orderByTime": "ASC","policy": "default","query": "domain:"$domain" and user_agent!='MSIE' and user_agent!='Zabbix'","refId": "A","resultFormat": "time_series","select": [[{"params": ["value"],"type": "field"},{"params": [],"type": "mean"}]],"tags": [],"timeField": "@timestamp"}],"thresholds": "0.5,0.8","title": "$domain 所有接口平均响应时间","type": "singlestat","valueFontSize": "50%","valueMaps": [{"op": "=","text": "N/A","value": "null"}],"valueName": "avg"},{"aliasColors": {"500": "#BF1B00"},"breakPoint": "50%","cacheTimeout": null,"combine": {"label": "Others","threshold": 0},"datasource": "Elasticsearch","editable": true,"error": false,"fontSize": "80%","format": "short","gridPos": {"h": 11,"w": 6,"x": 12,"y": 1},"id": 3,"interval": null,"legend": {"percentage": true,"show": true,"sortDesc": true,"values": true},"legendType": "Right side","links": [],"maxDataPoints": 3,"maxPerRow": 2,"nullPointMode": "connected","options": {},"pieType": "pie","strokeWidth": 1,"targets": [{"bucketAggs": [{"fake": true,"field": "status","id": "3","settings": {"min_doc_count": 1,"order": "desc","orderBy": "_count","size": "0"},"type": "terms"},{"field": "@timestamp","id": "2","settings": {"interval": "auto","min_doc_count": 0,"trimEdges": 0},"type": "date_histogram"}],"dsType": "elasticsearch","metrics": [{"field": "select field","id": "1","type": "count"}],"query": "domain:"$domain" and user_agent!='MSIE' and user_agent!='Zabbix'","refId": "A","timeField": "@timestamp"}],"title": "$domain HTTP 状态码","type": "grafana-piechart-panel","valueName": "total"},{"aliasColors": {"500": "#BF1B00"},"breakPoint": "50%","cacheTimeout": null,"combine": {"label": "Others","threshold": 0},"datasource": "Elasticsearch","editable": true,"error": false,"fontSize": "80%","format": "short","gridPos": {"h": 11,"w": 6,"x": 18,"y": 1},"id": 11,"interval": null,"legend": {"percentage": true,"show": true,"values": true},"legendType": "Right side","links": [],"maxDataPoints": 3,"maxPerRow": 2,"nullPointMode": "connected","options": {},"pieType": "pie","strokeWidth": 1,"targets": [{"bucketAggs": [{"fake": true,"field": "clientip.keyword","id": "3","settings": {"min_doc_count": 1,"order": "desc","orderBy": "_count","size": "10"},"type": "terms"},{"field": "@timestamp","id": "2","settings": {"interval": "auto","min_doc_count": 0,"trimEdges": 0},"type": "date_histogram"}],"dsType": "elasticsearch","metrics": [{"field": "select field","id": "1","type": "count"}],"query": "domain:"$domain" and user_agent!='MSIE' and user_agent!='Zabbix'","refId": "A","timeField": "@timestamp"}],"title": "$domain IP TOP 10","type": "grafana-piechart-panel","valueName": "total"},{"aliasColors": {"500": "#BF1B00"},"breakPoint": "50%","cacheTimeout": null,"combine": {"label": "Others","threshold": 0},"datasource": "Elasticsearch","editable": true,"error": false,"fontSize": "80%","format": "short","gridPos": {"h": 11,"w": 6,"x": 0,"y": 12},"id": 30,"interval": null,"legend": {"percentage": true,"show": true,"values": true},"legendType": "Right side","links": [],"maxDataPoints": 3,"maxPerRow": 4,"nullPointMode": "connected","options": {},"pieType": "pie","strokeWidth": 1,"targets": [{"bucketAggs": [{"fake": true,"field": "geoip.city_name.keyword","id": "3","settings": {"min_doc_count": 1,"order": "desc","orderBy": "_count","size": "10"},"type": "terms"},{"field": "@timestamp","id": "2","settings": {"interval": "auto","min_doc_count": 0,"trimEdges": 0},"type": "date_histogram"}],"dsType": "elasticsearch","metrics": [{"field": "select field","id": "1","type": "count"}],"query": "domain:"$domain" and user_agent!='MSIE' and user_agent!='Zabbix'","refId": "A","timeField": "@timestamp"}],"title": "$domain 访问前十的城市","type": "grafana-piechart-panel","valueName": "total"},{"aliasColors": {"500": "#BF1B00"},"breakPoint": "50%","cacheTimeout": null,"combine": {"label": "Others","threshold": 0},"datasource": "Elasticsearch","editable": true,"error": false,"fontSize": "80%","format": "short","gridPos": {"h": 11,"w": 6,"x": 6,"y": 12},"id": 31,"interval": null,"legend": {"percentage": true,"show": true,"values": true},"legendType": "Right side","links": [],"maxDataPoints": 3,"maxPerRow": 4,"nullPointMode": "connected","options": {},"pieType": "pie","strokeWidth": 1,"targets": [{"bucketAggs": [{"fake": true,"field": "geoip.region_name.keyword","id": "3","settings": {"min_doc_count": 1,"order": "desc","orderBy": "_count","size": "10"},"type": "terms"},{"field": "@timestamp","id": "2","settings": {"interval": "auto","min_doc_count": 0,"trimEdges": 0},"type": "date_histogram"}],"dsType": "elasticsearch","metrics": [{"field": "select field","id": "1","type": "count"}],"query": "domain:"$domain" and user_agent!='MSIE' and user_agent!='Zabbix'","refId": "A","timeField": "@timestamp"}],"title": "$domain 访问前十的省份","type": "grafana-piechart-panel","valueName": "total"},{"aliasColors": {"500": "#BF1B00"},"breakPoint": "50%","cacheTimeout": null,"combine": {"label": "Others","threshold": 0},"datasource": "Elasticsearch","editable": true,"error": false,"fontSize": "80%","format": "short","gridPos": {"h": 11,"w": 6,"x": 12,"y": 12},"id": 32,"interval": null,"legend": {"percentage": true,"show": true,"values": true},"legendType": "Right side","links": [],"maxDataPoints": 3,"maxPerRow": 4,"nullPointMode": "connected","options": {},"pieType": "pie","strokeWidth": 1,"targets": [{"bucketAggs": [{"fake": true,"field": "geoip.country_name.keyword","id": "3","settings": {"min_doc_count": 1,"order": "desc","orderBy": "_count","size": "10"},"type": "terms"},{"field": "@timestamp","id": "2","settings": {"interval": "auto","min_doc_count": 0,"trimEdges": 0},"type": "date_histogram"}],"dsType": "elasticsearch","metrics": [{"field": "select field","id": "1","type": "count"}],"query": "domain:"$domain" and user_agent!='MSIE' and user_agent!='Zabbix'","refId": "A","timeField": "@timestamp"}],"title": "$domain 国家/地区访问占比","type": "grafana-piechart-panel","valueName": "total"},{"aliasColors": {"500": "#BF1B00"},"breakPoint": "50%","cacheTimeout": null,"combine": {"label": "Others","threshold": 0},"datasource": "Elasticsearch","editable": true,"error": false,"fontSize": "80%","format": "short","gridPos": {"h": 11,"w": 6,"x": 18,"y": 12},"id": 14,"interval": null,"legend": {"percentage": true,"show": true,"values": true},"legendType": "Right side","links": [],"maxDataPoints": 3,"maxPerRow": 4,"nullPointMode": "connected","options": {},"pieType": "pie","strokeWidth": 1,"targets": [{"bucketAggs": [{"fake": true,"field": "request_method.keyword","id": "3","settings": {"min_doc_count": 1,"order": "desc","orderBy": "_count","size": "10"},"type": "terms"},{"field": "@timestamp","id": "2","settings": {"interval": "auto","min_doc_count": 0,"trimEdges": 0},"type": "date_histogram"}],"dsType": "elasticsearch","metrics": [{"field": "select field","id": "1","type": "count"}],"query": "domain:"$domain" and user_agent!='MSIE' and user_agent!='Zabbix'","refId": "A","timeField": "@timestamp"}],"title": "$domain 请求方法占比","type": "grafana-piechart-panel","valueName": "total"},{"circleMaxSize": "30","circleMinSize": "3","colors": ["rgba(0, 247, 0, 0.9)","rgba(237, 129, 40, 0.89)","rgba(240, 4, 45, 0.97)"],"decimals": 0,"esGeoPoint": "geoip.location","esLocationName": "","esMetric": "Count","gridPos": {"h": 15,"w": 24,"x": 0,"y": 23},"height": "600px","hideEmpty": false,"hideZero": true,"id": 35,"initialZoom": 1,"links": [],"locationData": "geohash","mapCenter": "custom","mapCenterLatitude": "30","mapCenterLongitude": "120","maxDataPoints": 1,"mouseWheelZoom": false,"options": {},"showLegend": true,"stickyLabels": false,"tableQueryOptions": {"geohashField": "geohash","latitudeField": "latitude","longitudeField": "longitude","metricField": "metric","queryType": "geohash"},"targets": [{"bucketAggs": [{"fake": true,"field": "geoip.location","id": "3","settings": {"precision": 3},"type": "geohash_grid"}],"dsType": "elasticsearch","metrics": [{"field": "select field","id": "1","type": "count"}],"query": "domain:"$domain" and user_agent!='MSIE' and user_agent!='Zabbix'","refId": "A","timeField": "@timestamp"}],"thresholds": "1000,10000","title": "$domain Word Map","transparent": true,"type": "grafana-worldmap-panel","unitPlural": "","unitSingle": "","valueName": "total"},{"aliasColors": {"500": "#BF1B00"},"breakPoint": "50%","cacheTimeout": null,"combine": {"label": "Others","threshold": 0},"datasource": "Elasticsearch","editable": true,"error": false,"fontSize": "80%","format": "short","gridPos": {"h": 11,"w": 24,"x": 0,"y": 38},"id": 12,"interval": null,"legend": {"percentage": true,"show": true,"values": true},"legendType": "Right side","links": [],"maxDataPoints": 3,"maxPerRow": 1,"nullPointMode": "connected","options": {},"pieType": "pie","strokeWidth": 1,"targets": [{"bucketAggs": [{"fake": true,"field": "request.keyword","id": "3","settings": {"min_doc_count": 1,"order": "desc","orderBy": "_count","size": "10"},"type": "terms"},{"field": "@timestamp","id": "2","settings": {"interval": "auto","min_doc_count": 0,"trimEdges": 0},"type": "date_histogram"}],"dsType": "elasticsearch","metrics": [{"field": "select field","id": "1","type": "count"}],"query": "domain:"$domain" and user_agent!='MSIE' and user_agent!='Zabbix'","refId": "A","timeField": "@timestamp"}],"title": "$domain request top 10","type": "grafana-piechart-panel","valueName": "total"},{"aliasColors": {"500": "#BF1B00"},"breakPoint": "50%","cacheTimeout": null,"combine": {"label": "Others","threshold": 0},"datasource": "Elasticsearch","editable": true,"error": false,"fontSize": "80%","format": "short","gridPos": {"h": 8,"w": 24,"x": 0,"y": 49},"height": "300px","id": 13,"interval": null,"legend": {"percentage": true,"show": true,"values": true},"legendType": "Right side","links": [],"maxDataPoints": 3,"maxPerRow": 1,"nullPointMode": "connected","options": {},"pieType": "pie","strokeWidth": 1,"targets": [{"bucketAggs": [{"fake": true,"field": "referer.keyword","id": "3","settings": {"min_doc_count": 1,"order": "desc","orderBy": "_count","size": "10"},"type": "terms"},{"field": "@timestamp","id": "2","settings": {"interval": "auto","min_doc_count": 0,"trimEdges": 0},"type": "date_histogram"}],"dsType": "elasticsearch","metrics": [{"field": "select field","id": "1","type": "count"}],"query": "domain:"$domain" and user_agent!='MSIE' and user_agent!='Zabbix'","refId": "A","timeField": "@timestamp"}],"title": "$domain referer top 10","transparent": true,"type": "grafana-piechart-panel","valueName": "total"},{"aliasColors": {"500": "#BF1B00"},"breakPoint": "50%","cacheTimeout": null,"combine": {"label": "Others","threshold": 0},"datasource": "Elasticsearch","editable": true,"error": false,"fontSize": "80%","format": "short","gridPos": {"h": 11,"w": 24,"x": 0,"y": 57},"id": 16,"interval": null,"legend": {"percentage": true,"show": true,"values": true},"legendType": "Right side","links": [],"maxDataPoints": 3,"maxPerRow": 1,"nullPointMode": "connected","options": {},"pieType": "pie","strokeWidth": 1,"targets": [{"bucketAggs": [{"fake": true,"field": "http_user_agent.keyword","id": "3","settings": {"min_doc_count": 1,"order": "desc","orderBy": "_count","size": "10"},"type": "terms"},{"field": "@timestamp","id": "2","settings": {"interval": "auto","min_doc_count": 0,"trimEdges": 0},"type": "date_histogram"}],"dsType": "elasticsearch","metrics": [{"field": "select field","id": "1","type": "count"}],"query": "domain:"$domain" and user_agent!='MSIE' and user_agent!='Zabbix'","refId": "A","timeField": "@timestamp"}],"title": "$domain user_agent top 10","type": "grafana-piechart-panel","valueName": "total"},{"collapsed": false,"gridPos": {"h": 1,"w": 24,"x": 0,"y": 68},"id": 37,"panels": [],"repeat": null,"title": "历史趋势","type": "row"},{"aliasColors": {},"bars": true,"dashLength": 10,"dashes": false,"datasource": "Elasticsearch","decimals": 0,"editable": true,"error": false,"fill": 0,"fillGradient": 0,"grid": {},"gridPos": {"h": 9,"w": 24,"x": 0,"y": 69},"id": 2,"legend": {"alignAsTable": true,"avg": true,"current": true,"max": true,"min": true,"rightSide": false,"show": true,"total": true,"values": true},"lines": true,"linewidth": 2,"links": [],"nullPointMode": "connected","options": {"dataLinks": []},"percentage": false,"pointradius": 5,"points": false,"renderer": "flot","seriesOverrides": [],"spaceLength": 10,"stack": false,"steppedLine": false,"targets": [{"bucketAggs": [{"field": "@timestamp","id": "2","settings": {"interval": "$inter","min_doc_count": 0,"trimEdges": 0},"type": "date_histogram"}],"dsType": "elasticsearch","metrics": [{"field": "select field","id": "1","type": "count"}],"query": "domain:"$domain" and user_agent!='MSIE' and user_agent!='Zabbix'","refId": "A","timeField": "@timestamp"}],"thresholds": [],"timeFrom": null,"timeRegions": [],"timeShift": null,"title": "$domain 请求数","tooltip": {"msResolution": true,"shared": true,"sort": 0,"value_type": "cumulative"},"type": "graph","xaxis": {"buckets": null,"mode": "time","name": null,"show": true,"values": []},"yaxes": [{"format": "none","label": null,"logBase": 1,"max": null,"min": null,"show": true},{"format": "none","label": null,"logBase": 1,"max": null,"min": null,"show": true}],"yaxis": {"align": false,"alignLevel": null}},{"aliasColors": {"404": "#3F2B5B","499": "#890F02","500": "#BF1B00"},"bars": true,"dashLength": 10,"dashes": false,"datasource": "Elasticsearch","decimals": 0,"editable": true,"error": false,"fill": 1,"fillGradient": 0,"grid": {},"gridPos": {"h": 9,"w": 24,"x": 0,"y": 78},"id": 7,"legend": {"alignAsTable": true,"avg": true,"current": true,"max": true,"min": true,"rightSide": true,"show": true,"total": true,"values": true},"lines": true,"linewidth": 2,"links": [],"maxPerRow": 1,"nullPointMode": "connected","options": {"dataLinks": []},"percentage": false,"pointradius": 5,"points": false,"renderer": "flot","seriesOverrides": [],"spaceLength": 10,"stack": false,"steppedLine": false,"targets": [{"bucketAggs": [{"fake": true,"field": "status","id": "3","settings": {"min_doc_count": 1,"order": "desc","orderBy": "_count","size": "10"},"type": "terms"},{"field": "@timestamp","id": "2","settings": {"interval": "$inter","min_doc_count": 0,"trimEdges": 0},"type": "date_histogram"}],"dsType": "elasticsearch","metrics": [{"field": "select field","id": "1","type": "count"}],"query": "domain:"$domain" and user_agent!='MSIE' and user_agent!='Zabbix'","refId": "A","timeField": "@timestamp"}],"thresholds": [],"timeFrom": null,"timeRegions": [],"timeShift": null,"title": "$domain HTTP 状态码","tooltip": {"msResolution": true,"shared": true,"sort": 0,"value_type": "cumulative"},"type": "graph","xaxis": {"buckets": null,"mode": "time","name": null,"show": true,"values": []},"yaxes": [{"format": "none","label": "状态码数量","logBase": 1,"max": null,"min": null,"show": true},{"format": "none","label": null,"logBase": 1,"max": null,"min": null,"show": true}],"yaxis": {"align": false,"alignLevel": null}},{"aliasColors": {"404": "#3F2B5B","499": "#890F02","500": "#BF1B00"},"bars": true,"dashLength": 10,"dashes": false,"datasource": "Elasticsearch","decimals": 0,"editable": true,"error": false,"fill": 1,"fillGradient": 0,"grid": {},"gridPos": {"h": 9,"w": 24,"x": 0,"y": 87},"id": 21,"legend": {"alignAsTable": true,"avg": true,"current": true,"max": true,"min": true,"rightSide": false,"show": true,"total": true,"values": true},"lines": false,"linewidth": 2,"links": [],"maxPerRow": 1,"nullPointMode": "connected","options": {"dataLinks": []},"percentage": false,"pointradius": 5,"points": false,"renderer": "flot","seriesOverrides": [],"spaceLength": 10,"stack": false,"steppedLine": false,"targets": [{"alias": "","bucketAggs": [{"field": "@timestamp","id": "2","settings": {"interval": "$inter","min_doc_count": 0,"trimEdges": 0},"type": "date_histogram"}],"dsType": "elasticsearch","metrics": [{"field": "select field","id": "1","type": "count"}],"query": "domain:"$domain" and responsetime:[$responsetime TO 100] and user_agent!='MSIE' and user_agent!='Zabbix'","refId": "A","timeField": "@timestamp"}],"thresholds": [],"timeFrom": null,"timeRegions": [],"timeShift": null,"title": "$domain 慢响应 时间>$responsetime s","tooltip": {"msResolution": true,"shared": true,"sort": 0,"value_type": "cumulative"},"type": "graph","xaxis": {"buckets": null,"mode": "time","name": null,"show": true,"values": []},"yaxes": [{"format": "none","label": "","logBase": 1,"max": null,"min": null,"show": true},{"format": "none","label": null,"logBase": 1,"max": null,"min": null,"show": true}],"yaxis": {"align": false,"alignLevel": null}},{"collapsed": false,"gridPos": {"h": 1,"w": 24,"x": 0,"y": 96},"id": 38,"panels": [],"repeat": null,"title": "Dashboard Row","type": "row"},{"columns": [{"text": "@timestamp","value": "@timestamp"},{"text": "clientip","value": "clientip"},{"text": "geoip.city_name","value": "geoip.city_name"},{"text": "http_user_agent","value": "http_user_agent"},{"text": "request_method","value": "request_method"},{"text": "request","value": "request"},{"text": "status","value": "status"},{"text": "responsetime","value": "responsetime"}],"datasource": "Elasticsearch","fontSize": "100%","gridPos": {"h": 13,"w": 24,"x": 0,"y": 97},"height": "500","id": 33,"links": [],"options": {},"pageSize": null,"scroll": true,"showHeader": true,"sort": {"col": 0,"desc": true},"styles": [{"alias": "Time","dateFormat": "YYYY-MM-DD HH:mm:ss","pattern": "/@time.*/","type": "date"},{"alias": "","colorMode": null,"colors": ["rgba(245, 54, 54, 0.9)","rgba(237, 129, 40, 0.89)","rgba(50, 172, 45, 0.97)"],"decimals": 2,"pattern": "/.*/","thresholds": [],"type": "number","unit": "short"}],"targets": [{"bucketAggs": [],"dsType": "elasticsearch","metrics": [{"field": "select field","id": "1","meta": {},"settings": {"size": 500},"type": "raw_document"}],"query": "domain:"$domain" AND status:$status","refId": "A","timeField": "@timestamp"}],"title": "$domain status:$status","transform": "json","transparent": true,"type": "table"}],"refresh": "30s","schemaVersion": 19,"style": "dark","tags": ["nginx","es","logstash","log"],"templating": {"list": [{"allValue": null,"current": {"tags": [],"text": "member.app.kf1999.cn","value": "member.app.kf1999.cn"},"datasource": "Elasticsearch","definition": "","hide": 0,"includeAll": false,"label": "域名","multi": false,"name": "domain","options": [],"query": "{"find":"terms","field":"domain.keyword"}","refresh": 1,"regex": "","skipUrlSync": false,"sort": 0,"tagValuesQuery": "","tags": [],"tagsQuery": "","type": "query","useTags": false},{"allValue": null,"current": {"text": "All","value": ["$__all"]},"datasource": "Elasticsearch","definition": "","hide": 0,"includeAll": true,"label": "状态码","multi": true,"name": "status","options": [],"query": "{"find":"terms","field":"status"}","refresh": 1,"regex": "","skipUrlSync": false,"sort": 0,"tagValuesQuery": "","tags": [],"tagsQuery": "","type": "query","useTags": false},{"allValue": null,"current": {"selected": true,"text": "2","value": "2"},"hide": 0,"includeAll": false,"label": "请求时间","multi": false,"name": "responsetime","options": [{"selected": false,"text": "1","value": "1"},{"selected": true,"text": "2","value": "2"},{"selected": false,"text": "3","value": "3"},{"selected": false,"text": "4","value": "4"},{"selected": false,"text": "5","value": "5"},{"selected": false,"text": "10","value": "10"}],"query": "1,2,3,4,5,10","skipUrlSync": false,"type": "custom"},{"auto": true,"auto_count": 100,"auto_min": "10s","current": {"text": "auto","value": "$__auto_interval_inter"},"datasource": null,"hide": 0,"includeAll": false,"label": "周期","multi": false,"name": "inter","options": [{"selected": true,"text": "auto","value": "$__auto_interval_inter"},{"selected": false,"text": "1s","value": "1s"},{"selected": false,"text": "5s","value": "5s"},{"selected": false,"text": "10s","value": "10s"},{"selected": false,"text": "30s","value": "30s"},{"selected": false,"text": "1m","value": "1m"},{"selected": false,"text": "10m","value": "10m"},{"selected": false,"text": "30m","value": "30m"},{"selected": false,"text": "1h","value": "1h"},{"selected": false,"text": "6h","value": "6h"},{"selected": false,"text": "12h","value": "12h"},{"selected": false,"text": "1d","value": "1d"},{"selected": false,"text": "7d","value": "7d"},{"selected": false,"text": "14d","value": "14d"},{"selected": false,"text": "30d","value": "30d"}],"query": "1s,5s,10s,30s,1m,10m,30m,1h,6h,12h,1d,7d,14d,30d","refresh": 2,"skipUrlSync": false,"type": "interval"}]},"time": {"from": "now/d","to": "now/d"},"timepicker": {"refresh_intervals": ["5s","10s","30s","1m","5m","15m","30m","1h","2h","1d"],"time_options": ["5m","15m","1h","6h","12h","24h","2d","7d","30d"]},"timezone": "browser","title": "Elasticsearch Nginx Logs","uid": "lvs7I6LZk","version": 11}
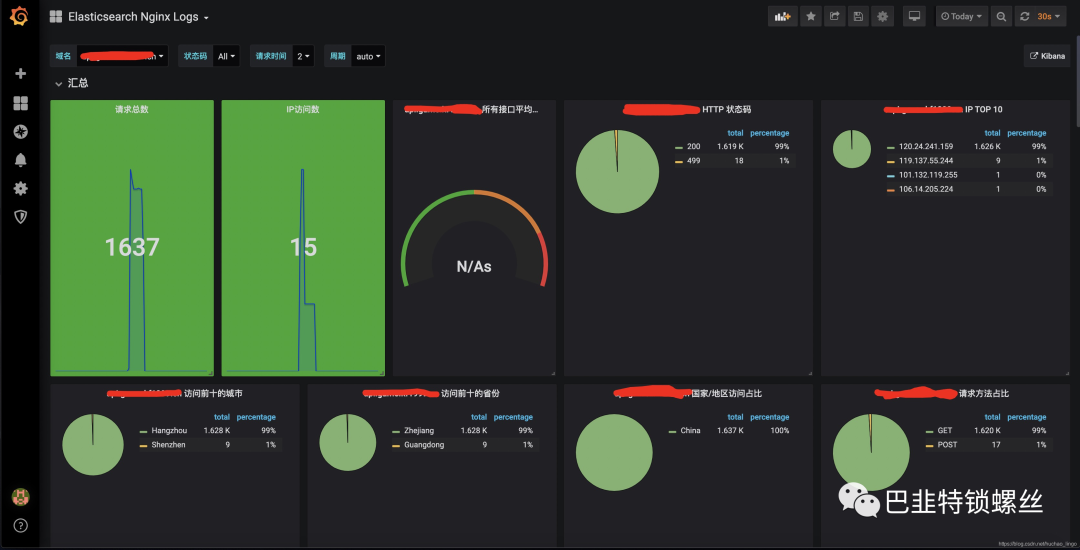
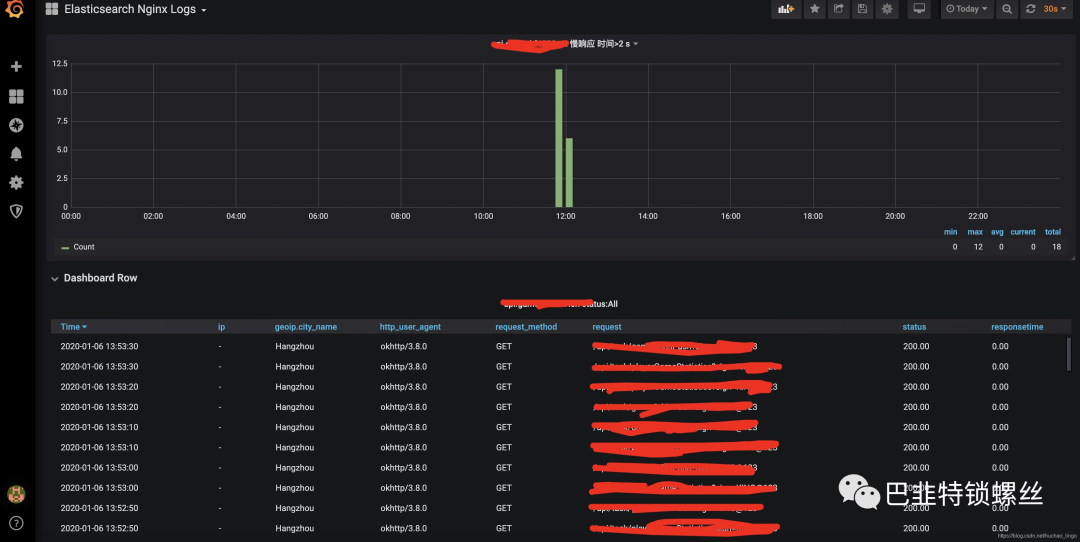
3、最终展示效果图如下
版权声明:本文内容来自知乎:huchao_lingo,遵循CC 4.0 BY-SA版权协议上原文接及本声明。本作品采用知识共享署名-非商业性使用-禁止演绎 2.5 中国大陆许可协议进行可。原文链接:https://blog.csdn.net/huchao_lingo/article/details/103860101如有涉及到侵权,请联系,将立即予以删除处理。在此特别鸣谢原作者的创作。此篇文章的所有版权归原作者所有,与本公众号无关,商业转载建议请联系原作者,非商业转载请注明出处。